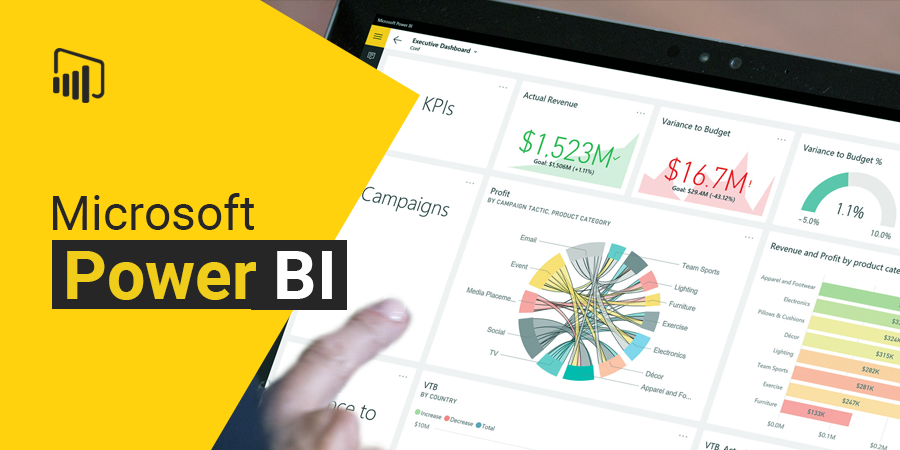
Course Overview:
The Data Analysis with Microsoft Power BI course is designed to teach participants how to use Power BI to analyze data and create interactive reports. Power BI, one of Microsoft’s leading data analysis and reporting tools, enables users to transform raw data into detailed reports and visualizations that support data-driven decision-making. Participants will learn how to import, clean, and visualize data, as well as how to share reports with teams and stakeholders.
Course Objectives:
- Understanding Power BI Fundamentals: Learn how to import data from multiple sources and transform it for use in Power BI.
- Innovative Data Analysis: Equip participants with the ability to analyze data and create reports and visualizations that help make more informed decisions.
- Interactive Data Visualization: Learn to create dynamic and interactive visualizations to explore data more effectively.
- Sharing Reports: Enable participants to share reports easily and efficiently with teams and decision-makers.
- Introduction to DAX: Master the basics of DAX (Data Analysis Expressions), a language used in Power BI for advanced data analysis.
Training Content:
- Introduction to Power BI: Overview of the tool and its benefits for data analysis and reporting.
- Data Import and Transformation: How to import data from various sources, clean it, and prepare it for analysis.
- Creating Reports and Dashboards: Building interactive visual reports and dynamic dashboards to enhance data understanding.
- Data Visualizations: Creating different types of visualizations such as charts, maps, and tables to present data effectively.
- DAX Language: Introduction to DAX and how to use it for performing advanced data analysis in Power BI.
- Sharing Reports: How to publish and share reports and dashboards with teams through Power BI Service.
- Advanced Data Analysis: Techniques for conducting advanced data analysis using Power BI’s tools and features.
Target Audience:
- Data Analysts: Looking to enhance their data analysis skills using modern tools.
- Business Managers: Seeking to make data-driven decisions through interactive analytical reports.
- Business Intelligence Developers and Analysts: Interested in building interactive reports and dashboards for teams or clients.
- Professionals in Finance, Marketing, and Strategic Planning: Who need to use data for performance analysis and actionable insights.
- Anyone Interested in Data Analysis: Looking to gain skills in data visualization and analysis using tools like Microsoft Power BI to improve their data-handling capabilities.


